
A Morning Alert and a Field Rush
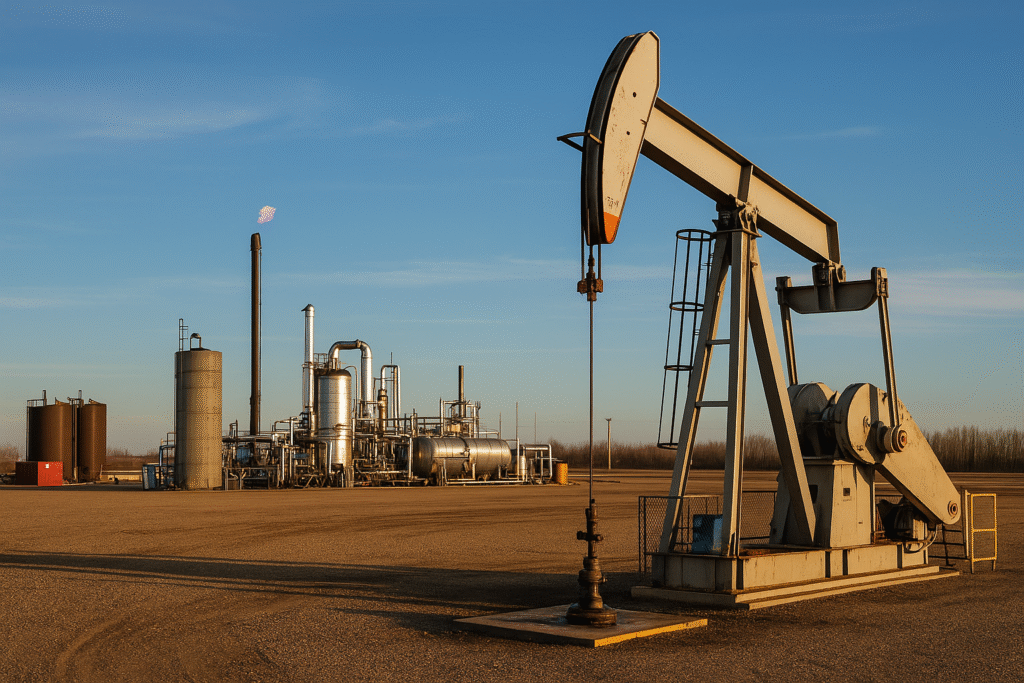
This started like any other shift—coffee in hand, I logged into our operations dashboard just before sunrise. Minutes later, a subtle spike in methane readings popped up on my screen. No dramatic whoop, just a little red dot blinking next to Compressor 7. By the time I reached the site, the day-team was stirring, and I could feel the cold metal rail under my palm as I crouched beside the flange. A quick check with our fugitive emissions monitoring system infrared scanner confirmed it: a hairline leak, barely perceptible to the naked eye but enough to bleed product—and sanity—if left alone.
Making Data Work for Us
Out here, data isn’t some abstract buzzword. It’s the heartbeat of every maintenance call and safety briefing. Our continuous monitoring setup—laser detectors mounted on racks, thermal cameras scanning pipes—feeds a live stream to my tablet. When a reading drifts off baseline, I get a location pin and severity estimate, so I’m not combing the yards. Last month, that meant catching a faulty valve gasket before it ballooned into a six-figure fix. Seeing those micro-leaks mapped over time taught me where our weak spots live—often around older equipment or during pressure swings—and that’s gold when you’re plotting maintenance windows.
The Technician’s Extra Eyes
Even the best continuous monitoring platform has blind spots, which is why I schedule seasonal fugitive emissions surveys alongside our analytics. A crack in a hidden gasket or a hairline fracture in a flange joint can evade even high-precision optics. That’s where our certified survey teams step in, walking every meter of piping and using handheld sniffers to verify system integrity. After each survey, I feed their findings into our software, enriching the leak-profile map with human-verified data. This hybrid approach—automated alerts plus hands-on surveys—raises our confidence that no leak, however small or fleeting, escapes notice.
Fast Fixes, Tight Timelines
Once a leak makes the cut, it’s go-time. I coordinate with field ops to grab calibrated flow-meter kits and replacement seals, timing the repair for early morning when line pressure dips. By mid-day, we’ve tightened the bolts, swapped the gasket, and reset our baseline. The satisfaction of logging a zero-leak reading right after—and watching that circle of green on my screen—is what keeps me coming back. It’s a grind, but knowing we’ve saved product and sidestepped potential fines makes every frost-bitten, hands-in-the-dirt moment worth it.
Bringing in the Experts
After nailing down our continuous monitoring and survey routines, the next leap is teaming up with specialist oil and gas environmental consultants. Their deep dive into LDAR protocols, regulatory filings, and bespoke process improvements helps us fine-tune every step—from our automated alerts to our manual inspections—so we squeeze maximum value out of each dollar spent on emissions control.
What Comes Next
By weaving together 24/7 sensor alerts, hands-on surveys, and expert consulting, we’ve cut response times from days to hours—and made a real dent in our methane numbers. Next, we’ll tackle how to embed calibration best practices and scale our mobile-mapping patrols under alt-FEMP to lock in predictable costs and stay ahead of regulators. Meanwhile, I’ll be preparing our detailed reports and compliance package to align with Directive 060 requirements.
Building on the Ground: Mobile Methane Mapping
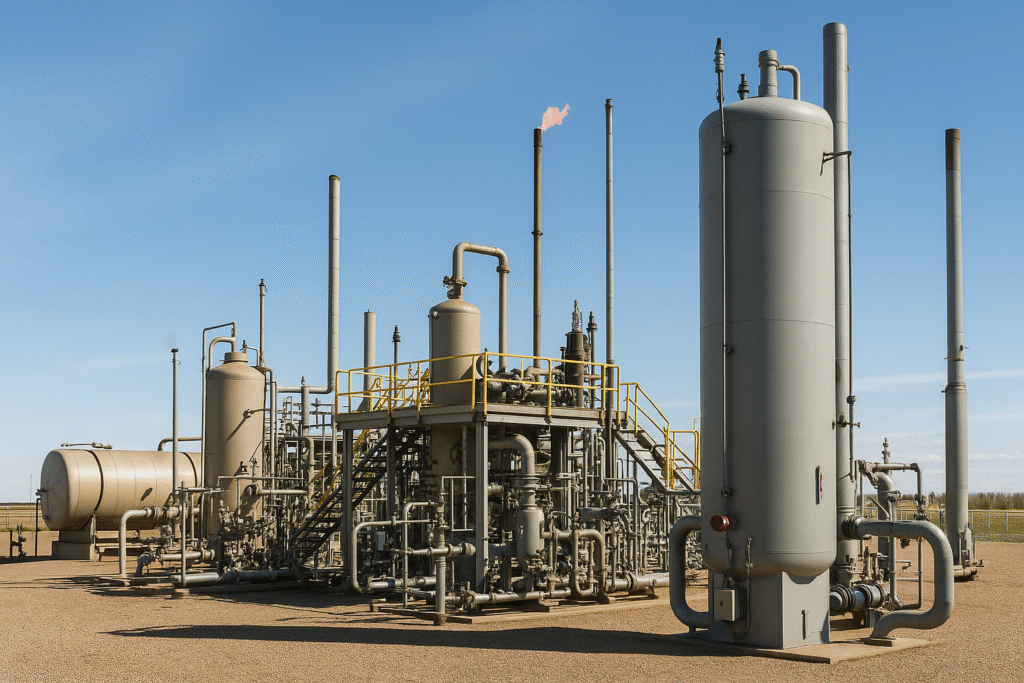
There’s something satisfying about rolling up to a new well pad in our methane-detection van. With the engine idling and sensors warmed up, I fire up the rooftop array—laser, cavity-ring-down spectrometer, and mini-oven for trace VOCs—and pull onto the site’s perimeter road. This truck-mounted fugitive emissions monitoring approach, validated by Natural Resources Canada’s mobile mapping pilots, lets us cover dozens of pads in a single shift, sweeping for leaks that even our fixed racks might miss. As we cruise past pipeline headers and compressor skids, the live data feed paints a heatmap of concealed emissions, turning fleeting spikes into stationary “hot spots” that guide my next move.
Turning Heatmaps into Action Plans
Back at my home-office trailer, I upload the drive logs to our GIS platform and watch pins pop onto a site map—each scaled by methane concentration. The largest pins often cluster around aging compressor seals, while smaller dots mark micro-leaks that, over time, add up to real lost volume. That visual report, complete with timestamps and recommended fixes, goes straight to field ops and maintenance crews—no more vague work orders. They know exactly where to tighten, reseal, or replace, cutting response times from days to hours.
Embedding Mobile Surveys into alt-FEMP
When we designed our Alternative Fugitive Emission Management Program submission, we highlighted this truck-based patrol as a core element of our leak-detection frequency. By crediting every kilometer driven and every sensor-verified hot spot, we secured faster approvals and a fixed-price agreement under alt-FEMP—no months of back-and-forth needed. Our geo-tagged logs and technician sign-offs demonstrated that our mobile mapping met or exceeded the prescriptive survey intervals in Directive 060, giving regulators confidence that we weren’t just compliant, but proactive. This mirrors the mobile sensing trials conducted by the Alberta Energy Regulator, which recognize truck-mounted sensors alongside aerial and OGI surveys.
Scaling for Every Shift
We didn’t stop at a single van. Seeing the value, I helped deploy two more units on our satellite sites, each tied into the same live analytics hub. Now, whether it’s a nighttime patrol in December frost or a midday run in sudden-death August heat, supervisors have eyes on every pad. This flexibility keeps our fugitive emissions monitoring one step ahead of equipment fatigue and process fluctuations—keeping our methane intensity metrics trending downward.
Closing the Loop with Continuous Improvement
Even after our alt-FEMP approval landed, I treat each mobile survey as a new data point in our ongoing refinement cycle. Hot spots from the last drive shape the next day’s patrol routes; recurring leaks trigger preventive maintenance orders rather than emergency call-outs. And as we gather more data, our analytics engine starts flagging probable leak zones before the sensors even blink—pushing us toward predictive stewardship.
By combining 24/7 sensor networks, hands-on surveys, mobile mapping, and alt-FEMP’s flexibility, we’ve gone from chasing unpredictable leaks to running a proactive, data-driven emissions program. Our methane intensity metrics have fallen each quarter, downtime is down by 30 percent, and compliance audits feel more like status updates. That’s what it looks like when an engineer on the ground takes ownership of emissions—one leak map at a time.